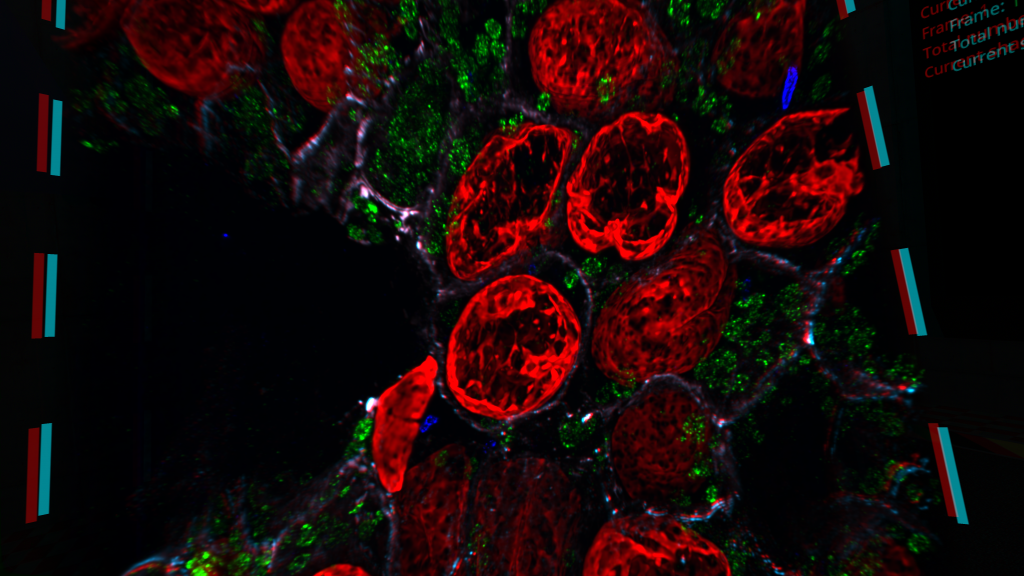
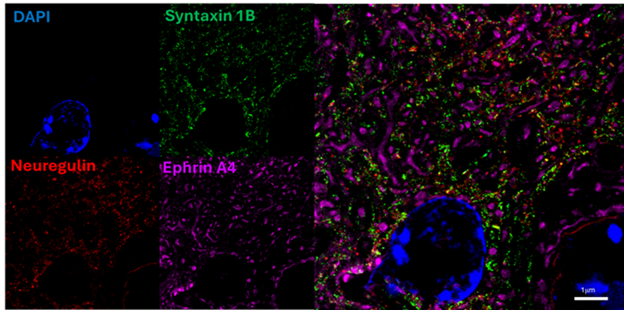
Skip to content

Magnify paper published in Nature Biotechnology!

  • by

Our core technology Magnify has been published in the top-tier peer-reviewed journal Nature Biotechnology!

https://www.nature.com/articles/s41587-022-01546-1

Update: The paper has been downloaded over 15K times in three months and highlighted by Nature Methods and Nature Biomedical Engineering Review, among many news outlets!

a, Magnify protocol. b, Magnify gel chemistry. (i), Species participating in free radical polymerization. (ii)–(v), Example interactions of gel monomers. c, Magnify expanded mouse brain section. Top, after incubation and polymerization (as in a, (ii)). Bottom, after hot surfactant homogenization and full expansion in ddH2O (as in a, (iv)). The tissue has expanded uniformly and without distortion; a small piece (top right of the gel) was lost during liquid transfer. EF = 10.5×. d, Fluorescent signal is retained after proteolytic digestion. Insets, zoom ins of boxed regions. EF = 3.1× in PBS. e, Comparison of protein retention in FFPE human kidney sections (blue) and PFA-fixed mouse brain sections (green) for different anchoring and homogenization strategies. f, Comparison of protein retention across tissue types for the Magnify framework. g, Postexpansion immunostaining with Magnify. Left, synapses in the mouse striatum immunostained after Magnify processing with homogenization in surfactant solution. Inset, a single synapse in boxed region. Middle, 3D reconstruction of the same FOV shown in the left panel. Right, 3D reconstructions of individual synapses EF = ~11× in ddH2O. h, Magnify enables visualization of nanoscopic synaptic architecture. (i),(ii), Synapses in the mouse brain labeled for total protein content with a fluorescent NHS ester dye. EF = ~10× in ddH2O. (iii), A hexagonal lattice of dense projections in mouse brain tissue expanded with Magnify. EF = ~11× in ddH2O. (iv), Electron micrograph of a synapse from a separate mouse brain sample with visible dense projections (arrows). i, Measurement of homer-bassoon synaptic pair distances across the mouse brain with Magnify. Left, regions marked with blue squares. (i),(ii), Primary motor cortex layers 5 (M1 L5) and 6 (M1 L6). (iii),(iv), Primary somatosensory cortex layers 4 (S1 L4) and 6 (S1 L6). (v), DMS. (vi), NAc. EF = 3.6× in 1× PBS. Right, (i)–(vi), zoom ins of boxed regions; insets, representative synapses. Pair distance (center to center) was measured in each region. Scale bars, c, 5 mm; d, 10 µm; inset, 2 µm; g, left, 1 µm, left inset, 250 nm, middle, 5 µm, right, 250 nm; h, (i),(ii), 200 nm, (iii), 100 nm, (iv), 200 nm; i, tissue overview, 2 mm, zoom ins, 5 µm. Scale bars are all in biological scale.

Leave a Reply

Your email address will not be published. Required fields are marked *